Welcome to the help page of ECstep’s Neural Network Program
This program can be used to develop advanced neural networks using your data.
Dataset
The dataset to be analyzed should be organized in a table format where each line holds the data of one record and each column holds the specific measurements of each characteristic.
The simplest way to organize the data in a table is to use a spreadsheet program like EXCEL.
For the neural network’s program to use the data, it should be in a TAB-separated text format (TSV format). EXCEL can save data in that format.
Preferably the first line in the dataset should be a header line holding the names of each column. If such a line is not present in the dataset, the program will insert a header line with names like this “Variable 1, Variable 2, Variable 3, and so on.”
1. Load data
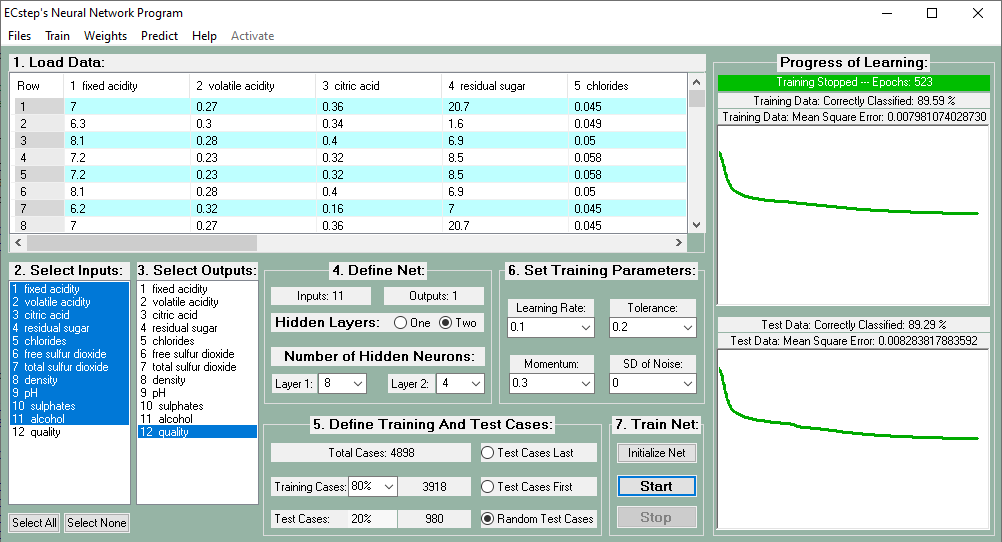
The first step is to load the data into the program. To develop a neural network you start by loading a set of training data. Click “Files” and then “Load Training Data”. The data will then appear in the top left window as shown in the figure below. You can easily scroll through the whole dataset.
2. Select Inputs
The next step is to select those variables that should be used as inputs to the neural network.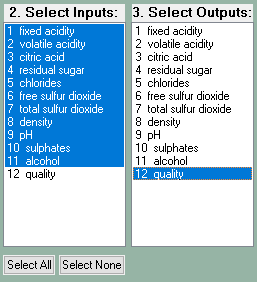
You just click the variables in the Select Inputs list box to select them.
Sometimes you need a large number of variables to serve as inputs – maybe a hundred or more. To facilitate the selection of very a large number of input variables, you can just click the button “Select All”. Afterward, you can deselect the probably rather few variables you do not need as input variables. You do this by clicking them individually.
3. Select Outputs
In the Select Outputs list box, you click the variable(s) you need as output(s). That will automatically deselect the same variable(s) as input variables if they were among those selected as inputs. The Input and Output list boxes scroll in parallel. If you select a variable in one of the list boxes it is automatically deselected in the other.
4. Define Net
Number of hidden layers
After you have specified the Input and Output variables their number will be displayed. Now you need to specify the number of hidden layers.
You just click the radio button corresponding to the number of hidden layers you need.
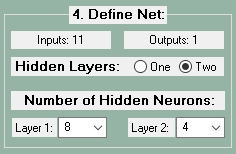 A single layer may be sufficient in most cases. However, if the number of inputs is large and you suspect a complex data structure, it may be necessary to use two hidden layers.
Neural networks with two hidden layers can represent functions of any shape. Neural networks with more than two hidden layers do not give better results.
Number of neurons
Next, you specify the number of neurons in the hidden layer(s). You do this by selecting the number of neurons in the drop-down list(s). The optimal number of neurons in the hidden layer(s) is difficult to specify. Often it will be necessary to test different net configurations with different numbers of hidden neurons to see which will give the best result.
5. Define Training And Test Cases
The training dataset consists of a number of example records or cases of input variables and the corresponding output variables. After training the resulting neural network will be particularly well adapted to the training dataset.
Normally the neural network should be able to predict the outputs using independent data. It should be useful generally.
The general usefulness of the neural network is analyzed using independent test data.
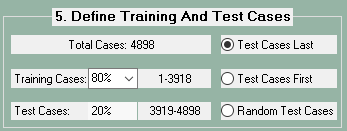 The program allows splitting the loaded data into a training and test dataset. This can be done in two ways.
Sequential data splitting (default): You can use the drop-down list to specify the percentage of the data that should be training cases. The remaining percent will automatically be the test cases. By clicking the appropriate radio button you can specify if the test cases should be the last or the first part of the data. The data lines belonging to the training and the test part, respectively, will be displayed automatically.
Random data splitting: By clicking the radio button “Random Test Cases” the data will be split randomly into training and test cases according to the selected percentages. You can specify the test dataset to the following percentages: 5, 10, 15, 20, 25, 30, 35, 40, 45, or 50%. The program will automatically perform the random splitting of the data according to the percentage you select.
6. Set training parameters
Learning Rate
The learning rate controls how quickly the neural network is adapting to the problem.
Smaller learning rates require more training given the smaller changes made to the weights after each update.
Larger learning rates result in more rapid changes and require fewer training epochs.
However, a learning rate that is too large can cause the model to converge too quickly to a suboptimal solution. Sometimes a large learning rate can cause the mean square error to fluctuate. Then you need to decrease the learning rate to a much lower value.
The best value of the learning rate is difficult to ascertain. It will depend on the specific problem and dataset. You may have to experiment with the value.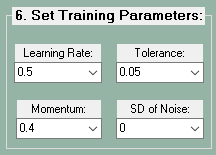
Initially, the learning rate is set to 0.5. You may specify another value. If learning turns out to be too slow, the learning rate may be increased after pausing the training. If learning seems to be stuck, you may try a lower learning rate.
Momentum
The momentum is a parameter (between zero and one) that specifies the fraction of the previous weight update that should be added to the current one.
When the gradient keeps pointing in the same direction, a large momentum will increase the size of the steps taken to the minimum. It is therefore often necessary to reduce the learning rate when using a large momentum (close to 1). Alternatively, you can decrease momentum in this situation.
If you combine a high learning rate with a lot of momentum, you will rush past the optimal solution with huge steps!
Initially, the momentum is set to 0.8. You may specify another value and you may later change the value after pausing training of the network.
Tolerance
The tolerance is the maximum difference between the correct output and the output predicted by the neural network for any of the outputs. The smaller the tolerance, the higher the prediction precision the neural network is being trained to obtain.
Initially, the tolerance is set to 0.05. You may specify another tolerance initially or in a pause during training.
When the neural network predicts all outputs correctly – within the specified tolerance – for all the training records, training stops automatically.
Noise
Training a neural network with a small dataset can lead to overfitting and poor performance on a new dataset.
Adding noise to the weights during training can improve the robustness of the network, resulting in better generalization and faster learning.
Initially, the noise is set to zero. If training is not successful with zero noise, you may add a normally distributed noise with a small standard deviation (SD) to the inputs after pausing the training.
7. Train Net
Now you should be ready to train the net. The first step is to “initialize” the net by giving the weights in the network random starting values.
After that, you click “Start” to start training the net. At any time you can stop training by clicking “Stop”.
During a pause, you may change some of the training parameters to improve learning. Then you can continue training by clicking “Start”. You can stop training and adjust training parameters many times during training.
Sometimes – if learning is very poor – it may be worthwhile to restart after a new “initialization”, which may give more favorable starting weights for the network.
Progress of Learning
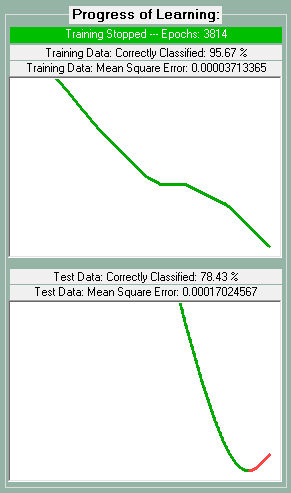
In the windows on the right side of the program, you can follow the learning progress both graphically and in numbers showing the percentage of correct classification at the specified tolerance and the mean square error between the predicted and the actual correct output.
The results of training are updated every 0.3 seconds. At the top, the Number of Epochs i.e. the number of passes through the whole dataset is shown.
If the dataset is small, learning may be completed before a graphic curve is shown.
The progress of learning using the training data is shown in the upper section.
If data splitting has been performed the progress of prediction using the test data is shown in the lower section.
As long as the neural net is learning, the mean square error will decrease as shown by a falling green curve in the continuously moving graphic display(s).
If during training the mean square error increases, learning is deteriorating and a rising curve in red color is shown.
If that is the case it is time to stop and change training parameters. If that does not increase learning, it is likely that learning has reached it’s optimum and that further training will only lead to overfitting. A sign of this happening is if the mean square error starts to rise for the test data (lower window) while it still falls for the training data (upper window). When this happens the neural network has been trained optimally and training should stop.
Predict using the trained net
When the neural net has been successfully trained, it can be used to predict outcomes in new data.
Below you see the simple data used to develop a net to predict the XOR (exclusive or) function. The output (Y) should be predicted by the two inputs X1 and X2. Y should be 1 if X1 and X2 are different, otherwise, Y should be 0.

Using a net with 2 neurons in a single hidden layer training was performed to a tolerance of only 0.000001.
Using the trained net the predicted Y values can be obtained. If you click the menu item “Predict” and “Make Prediction”, then the predicted Y-values will be displayed as “Pred. Y” in a separate column after the Y column as shown below.

As you can see the predicted Y-values are rather close to the Y-values (within the specified tolerance).
Save Prediction
You can now save the data file with the prediction results. You do this by clicking the menu item “Files” and then “Save Prediction”. Then the results will be saved in TAB-separated text format, which can be read by many programs including EXCEL. This will allow you to study the predictions in detail.
Save Net
To use the trained net to predict the output(s) of new data you need to save the net to the computer. You do this by clicking the menu item “Files” and then “Save Net”. Then the net will be saved in text format using the file filter string “.net”. You can reload the net and use it immediately for making predictions using new data.
View the weights in the neural network
If you want to see the weights in the trained neural network you just click the menu item “Weights” and then “View Weights”. The weights will now be shown together with the range of input and output variables as seen in the figure below.
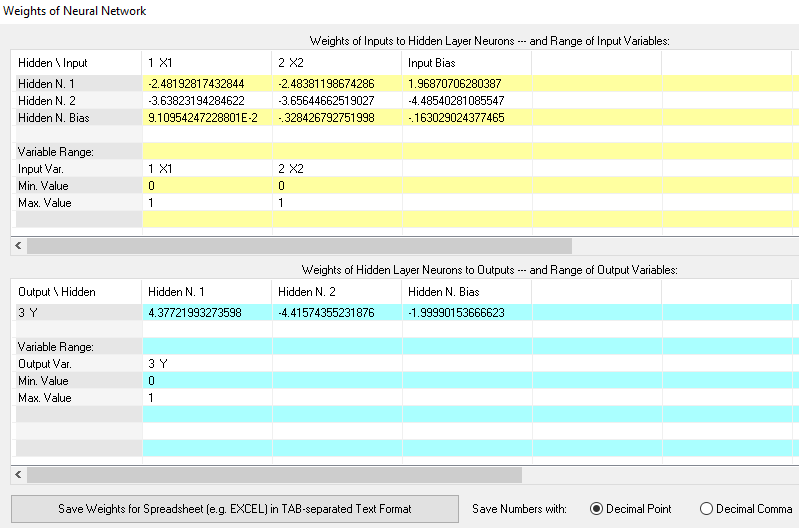
Please note that weights for biases are included. Biases are included because they improve the learning of the net. The program automatically adds a single bias node for the input layer and for each hidden layer.
The bias nodes are always set to 1. They are analogous to the intercept in a regression model. That is probably why learning is improved with biases.
You can also save these displayed data for illustration and other purposes in TAB-separated text format, which can be read by many programs including EXCEL. Please note: this format is only for illustrative purposes and cannot be used by the neural networks program.
Using the net to make predictions from new data
The new data you want to make predictions from should include all the input variables used in the net. These input variables should be organized in exactly the same tabular format as in the dataset used for training the net.
You can use a spreadsheet program like ECXEL to organize the data. For the neural networks program to be able to read the data, it should be saved in a Tab-separated text format. ECXEL can do that.
a. Load Prediction Data
You load the prediction data by clicking the menu item “Files” and then “a. Load Prediction Data”. The data will now be visible in the top left window as shown below.
b. Load Trained Net
Next, you load the trained net corresponding to the prediction data. You do this by clicking the menu item “Files” and then “b. Load Net”.
If you load the wrong net you will be warned of the data and the net being incompatible.
When you load the right compatible net, the correct inputs will be chosen automatically and locked. No outputs will be selected.
Predict the Output(s)
Now you are ready to calculate the predictions of the net using the new data. You click the menu item “Predict” and then “Make Prediction”.
The program will immediately compute the prediction of the output(s) corresponding to all cases of the new data.
As before the results will be displayed in column(s) immediately following the last column of the prediction data. The column header(s) will be “Pred.” followed by the output name(s) as shown below.
As before the results can be saved in TAB-separated text format by clicking the menu item “Files” and then “Save Prediction”.


