2. The normal distribution
The normal (or Gaussian) bell-shaped distribution is a very common continuous probability distribution first described by the German mathematician Karl Friedrich Gauss (1777-1855).

Normal distributions are important in statistics and are often used in the natural and social sciences to represent real-valued random variables whose distributions are not known.
Physical quantities that are expected to be the sum of many independent processes (such as measurement errors) often have distributions that are nearly normal.
Any normal distribution can be described by just two numbers: mean and standard deviation.
The Mean or Average indicates where the density function peak is located on the x-axis.
The Standard Deviation (S.D.) is a measure of how much observations spread around the mean, i.e. how flat the distribution is. A small standard deviation corresponds to a high, narrow distribution, while a large standard deviation corresponds to a low, wide distribution.
–
–
–
The Central Limit Theorem
 The normal distribution is very useful because of the Central Limit Theorem: averages of random variables independently drawn from independent distributions become normally distributed when the number of random variables is sufficiently large.
 In practice, the approximation to the normal distribution is often sufficiently good so long as the sample size is larger than 20 and the underlying distribution is reasonably symmetrical. If the distribution is skewed i.e. asymmetrical, the sample size should be 30 or larger before the means can be assumed to be distributed normally.
–
–
–
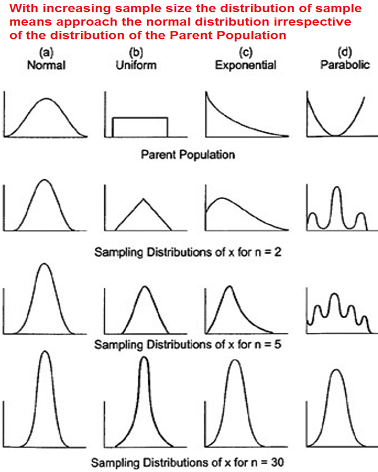
Distribution of means in random samples
The illustration to the left shows the distributions of the means in random samples of different sizes from different populations.
The average of sample means is equivalent to the population mean and is located at the sample density function maximum.
If the observations in the population are normally distributed, the means of the samples have a normal distribution regardless of sample size.
If the observations in the population are not normally distributed, the means of the samples approach a normal distribution as the sample size increases. This will happen faster for symmetrical than for asymmetrical distributions.
With increasing sample size, the distribution of the sample means becomes gradually narrower, i.e. the standard deviation becomes smaller.
–
–
–
The Standard Error of the Mean (SEM)
The standard deviation of the means is called the Standard Error of the Mean (SEM). , Standard Error of the Proportion (SEP) and the Standard Normal Deviate (the Z-score)") One can show that SEM decreases with increasing (square root of the) sample size (N), see equation 2.1. Thus SEM is halved if the number in the sample is increased by a factor four. The larger the sample, the closer its mean is to the mean of the population.
One can show that SEM decreases with increasing (square root of the) sample size (N), see equation 2.1. Thus SEM is halved if the number in the sample is increased by a factor four. The larger the sample, the closer its mean is to the mean of the population.
In practice, the normal distribution is often used for calculation of probabilities. The formula for the normal distribution is rather complicated. However, all normal distributions are uniquely determined by the mean and standard deviation, and it’s easy to go from one normal distribution to another.
–
–
–
Distribution of proportions in random samples
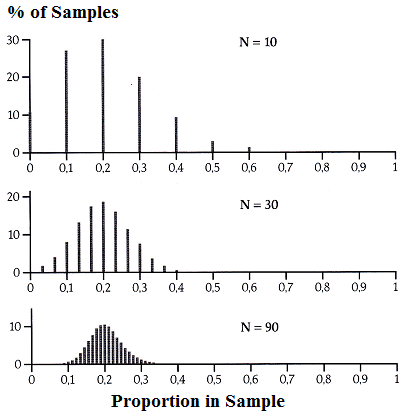 The illustration to the left show the distribution of the proportion in 1000 random samples from a population with a proportion of the property of 0.2 (20%), the sample size being 10 (top), 30 (middle) and 90 (bottom).
It appears that with increasing sample size the distribution becomes narrower, more even (smaller steps in the distribution), and more symmetrical and bell-shaped.
–
–
–
Standard Error of the Proportion (SEP)
The distribution of proportions is identical with the so-called binomial distribution. However, with increasing sample size the binomial distribution approaches the normal distribution with a mean equal to the proportion P and a Standard Error of the Proportion (SEP) calculated as in equation 2.2.
The standard error decreases with increasing (square root of the) sample size N. Increasing the sample size, for example by a factor four will halve the standard error. The larger the sample is, the closer its proportion will be at the proportion in the population.
–
–
–
The Standard Normal Distribution
The normal distribution with a mean of zero and a standard deviation of one is called the standard normal distribution.  This is used for calculation of probabilities.
The total area under the curve from minus infinity to plus infinity is one, as the sum of the all probabilities is one.
The Y-value for a given point on the curve is the probability density. It is highest in the middle at point zero and decreases to both sides.
The area under the curve for a given interval indicates the probability that an observation lies in the interval.
Usually the probability is given as a function of the deviation from the mean. This is the so-called Standard Normal Deviate (Z-score) (see equation 2.3), which is frequently tabulated as 1) one-sided probabilities, i.e. probabilities from Z to plus infinity, or 2) two-sided probabilities, i.e. the probability from a negative Z value to minus infinity plus the probability from the corresponding positive Z value to plus infinity.
The distribution of proportions in samples follows a binomial distribution, which is rather difficult to calculate. However, as mentioned above the binomial distribution approaches the normal distribution if the sample is sufficiently large and the conditions below equation 2.4 are fulfilled. Then it is possible to use a Z-score for a proportion (equation 2.4) that approximates rather closely the standard normal distribution.
Here is a link to a table of the standard normal distribution giving the one-sided probabilities for Z to plus infinity. To obtain the two-sided tail probabilities, the values need to be doubled. Most statistical textbooks tabulate the standard normal distribution.
Compute online
Using this link you can calculate the probability online from the Z-value or the Z-value from the probability.